How do I best utilize my home dashboard?
Leveraging the home dashboard's configurable widgets can help you maximize efficiency and value in the application.
Proformex's new home dashboard will be available and the new landing page for all users on Wednesday, February 8th, 2023.
Overview
Video Tutorial
Home Dashboard Layout
Configure Your Dashboard
Overview
Proformex's home dashboard is designed to give you quick access to the policy information in your account that is most relevant to your firm and your specific role. The "Quick Actions" and configurable widgets are aimed to drive you quickly to where you need to go in the application to begin taking the next steps with your clients and teams.
Video Tutorial
Home Dashboard Layout
Please note that the below images are examples and the exact content of your home dashboard may vary from those depicted below. If you'd like support updating your home dashboard configuration, please contact your Customer Success Manager.
1. Aggregate Summary of Firm's Book of Business

Aggregate totals for the firm's inforce policies will be listed in the top-left quadrant of the dashboard. If your firm has annuities in your account, those will be included in the total contract and top-level aggregate amount (assets under management instead of death benefit only).
The trendline will display the changes in your total death benefit (or assets under management) over the last 3 months, with a specific % change over displayed for the last month. If there has been no change, no trendline will be included.
2. Quick Actions

Proformex will highlight policies that we see other customers have success acting regularly on. These include policies that have a lapse pending status, approaching a term conversion date, amongst others.
Hit the refresh button to view other policies that we've highlighted for you.
This section is targeted for users who are working closely on individual cases and would like to start with a few "quick wins" to get traction using Proformex or aren't sure where to start.
Customers who may have well established processes or manage larger books and providing information to agents/advisors may find the other areas of the home dashboard more useful.
3. Pie Chart Widget

The pie chart widget provides a visual representation of any selected report by product type. Whether you're looking at lapse pending policies or your entire book, this could be a great tool to help breakdown your book into a more manageable block of policies to get started.
Select any of the pie chart's slices or the "View Report" selection to dive into the accompanying policy report.
4. Bar Chart Widget

The bar chart widget displays the policy count and death benefit total for policies with upcoming premium due dates over the next 90 days. You can configure this to any specific report and the bar chart will identify the upcoming premiums for the selected subset of policies.
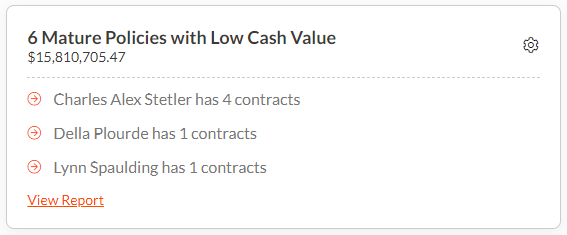
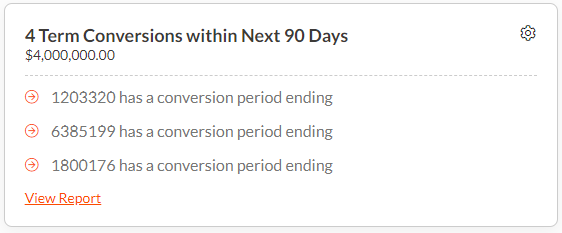
5. Report Widgets


Each report widget displays the policy count and death benefit total for policies that fall within the selected report. The preview above will also show the top three agents or owners with the most policies in that report, or the first three policies by the sort arrangement in the report.
Click the "View Report" selection to view all policies in the specified report or click into the individual line to view the Policy Details page for the policy-centric view or a filtered version of the report for the agent-centric or owner-centric views.
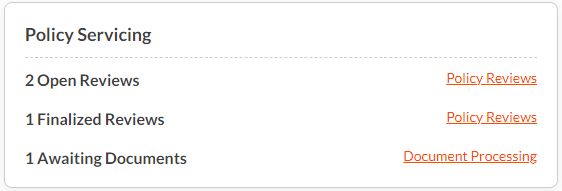
6. Servicing Widget

The Servicing widget will contain a summary of policies in the review process or awaiting documents to be uploaded for processing.
Click into any of the links to be directed to the respective page to continue the review or document upload processes.
The Servicing Widget is only available for customers who have purchased the Servicing Module, which is an add-on to many of our customer's current subscription. Please contact your Customer Success Manager if you'd like additional information.
Configure Your Dashboard
Your home dashboard is unique to you and your firm so that you can curate it to your specific needs and use of Proformex. Continue reading for a step-by-step guide to personalize your dashboard.
User vs. Firm Configuration
Any changes that you make to the configuration of the dashboard are specific to your user, meaning others on your team will not see the changes you make to your dashboard. This allows different members of your team to personalize their dashboard for their specific role.
If you'd like any special configuration made across your firm, including the addition or removal of widgets, please contact your Customer Success Manager.
1. Start by ensuring policy reports are made
By navigating from Reports > Policy Reports, you'll be able to see all reports that are available for you to utilize for your home dashboard widget configuration. Please note that Agent and Owner Reports are not currently supported on the home dashboard.
If you need help getting started creating new policy reports, check out our step-by-step guide here.
2. Select the configure icon on the dashboard widget you'd like to adjust

Once the appropriate policy reports have been created, you can begin configuring your dashboard widgets using the configure icon in the top right corner.
3. Select the report and update the title, label

Select the desired report from the dropdown and update the widgets title and label (the label will only be available for report widgets displaying individual policies).
If you have the Proformex Annuity Module, you can add annuity reports to your home dashboard widgets as well.
If you have any issues or suggestions please don't hesitate to reach out to your Customer Success Manager for support or to share feedback!